Case study · Personal project · AI-assisted · 2026
Faultline
Understand how a system behaves when a dependency fails.
What happens to a request when the service behind it slows down? And can someone else check the answer afterwards?
Faultline is a local reliability lab. It measures a small containerized service, slows the link to its dependency on purpose, measures the failure and the recovery, and exports the whole run as a file that can be verified offline.
ScopeIt runs only on its own isolated sample services. It is early developer tooling, not production chaos infrastructure.
See where the deadline cuts Source on GitHub Release v0.1.0 80-second demo
- 80 ms injected2xx 83.16 ms mean0 of 10 failed
- 400 ms injectedHTTP 504 253.20 ms mean5 of 5 failed
Bars: the latency each run injected. Ticks: the recorded mean response time while it was injected. The frontend's deadline is 250 ms.
Project overview
Below the frontend’s 250 ms deadline, injected latency only slows requests: with 80 ms injected, the recorded mean was 83.16 ms and none of 10 failed. Above it, the deadline answers first: with 400 ms injected, all 5 requests failed with HTTP 504 at a mean of 253.20 ms. Both runs recovered once the latency was removed.
See where the deadline cuts Source on GitHub Watch the 80-second demo
- Built with
- Go · Docker Compose · Toxiproxy · OpenTelemetry · SQLite · React
- Scope
- It runs only on its own isolated sample services. It is early developer tooling, not production chaos infrastructure.
- Release
- Release v0.1.0 publishes only the offline evidence tool, for macOS and Linux. Experiments, the full CLI and the dashboard run from source with Docker.
- Authorship
- Personal project · AI-assisted
01A controlled experiment
One request path, one owned fault, three measured phases.
Every experiment runs against the same four containers in an isolated Docker Compose project. The runner creates the fault, measures what the requests see, removes it and cleans up after itself.
- RunnerGo CLI and engineSends one request at a time. Has no Docker access.
- FrontendSample serviceCalls its dependency through the proxy, with a 250 ms timeout.
- ToxiproxyProxy on the data portCreated and owned by the run. Holds the latency only during the fault.
- DependencySample serviceReturns a constant JSON value. No handler sleeps to fake a delay.
Control laneToxiproxy's control API: create the proxy, add and remove the latency, delete the proxy. It is never published outside the project.
- One isolated Docker Compose project per experiment
- No Docker socket in containers, no host networking, no privileged containers
- Each runtime container is held to 64 MiB, half a CPU and 64 processes
- Images pinned by manifest digest
The lifecycle of one run
- ValidateSample count and durations are checked before any control request.
- OwnA random 128-bit ownership ID is generated, and the proxy's deletion is registered before the proxy is created.
- Warm upRequests run until the path is ready, for five seconds at most. They are not recorded.
- BaselineThe workload is measured. Any failure stops the run before a fault is added.
- FaultA downstream latency toxic, with zero jitter, delays every reply from the dependency.
- RecoveryThe toxic is removed and the same workload runs again. A failure here fails the run.
- Clean upThe owned proxy is always deleted, under a fresh five-second timeout. Cleanup errors are reported with any original error.
- ReportOnly then is the JSON report finalized.
- Samples
- 1–100 per phase
- Injected latency
- 1 ms – 5 s
- Request timeout
- 10 ms – 5 s
- Whole run
- 2-minute deadline
- Cleanup
- Separate 5-second budget
The boundaryFaultline runs experiments only on its own isolated sample topology. It is not production chaos engineering infrastructure: it has no arbitrary targets, no browser fault control and no hosted service.
02Where the deadline cuts
Below the deadline, latency slows a request. Above it, the deadline answers first.
The frontend gives its dependency 250 ms. Two runs from the same validation record sit on either side of that line.
At a quarter of the real speed. Nothing runs in your browser.
clean-400.flb400 ms latency, zero jitterTracing on5 sequential requests per phaseCommit 27b3775
- Runner Sends the request and times itHTTP 504 · 253.20 ms mean
- Frontend Waits for the dependency, 250 ms at mostGives up, answers 504
- Toxiproxy Holds the dependency’s reply for 400 msNever waited for
- Dependency Answers at once with a constant JSON value
- Baseline0.58 ms mean0 of 5 failed
- Fault · +400 ms253.20 ms mean5 of 5 failed, HTTP 504
- Recovery · latency removed0.36 ms mean0 of 5 failed
- Recorded run Response times and outcomes
- Verified in source The latency and the deadline, as configured
- Conceptual illustration The order of events inside one request
What the two runs show
With 80 ms injected, the delayed reply arrives before the deadline. The frontend answers normally: the recorded fault mean is 83.16 ms, and none of the 10 requests failed.
With 400 ms injected, the frontend stops waiting at 250 ms and answers HTTP 504. The runner records 253.20 ms, not 400: the last 150 ms of the injected delay is never observed by the caller.
After each fault the latency was removed and the same requests ran again: 0.25 ms and 0.36 ms on average, with no failures.
Two separate recorded runs from clean commit 27b3775, with different sample counts and tracing settings. They show the mechanism, not a benchmark, and the page draws no conclusion from their other differences.
| 80 ms run | 400 ms run | |
|---|---|---|
| Injected latency | 80 ms, below the deadline | 400 ms, above the deadline |
| Tracing | Off | On |
| Requests per phase | 10 | 5 |
| Baseline mean | 2.17 ms | 0.58 ms |
| Fault mean | 83.16 ms | 253.20 ms |
| Failed under the fault | 0 of 10 | 5 of 5, HTTP 504 |
| Recovery mean | 0.25 ms | 0.36 ms |
| Evidence file | clean-80.flb, 4,170 bytes | clean-400.flb, 5,162 bytes |
| SHA-256 | bb6c3d4c…ea8572 | e265b73a…7caea5 |
Both from clean commit 27b3775; each completed, confirmed cleanup and was exported twice with identical bytes. docs/validation.md
03Recovery, cleanup and traces
Every fault it adds, the run owns and removes.
Recovery is part of the measurement, cleanup is part of the run, and with tracing on, each failed request can be followed from the runner to the dependency.
Recovery and cleanup Verified in source
- Recovery is measured, not assumed: the same requests run after the latency is removed, and a failure there fails the run.
- The proxy's deletion is registered before the proxy is created, so even an ambiguous create is cleaned up.
- Cleanup runs under its own fresh five-second timeout, after cancellation or failure too, and its errors are reported.
Where the guarantee endsA SIGKILL, a host crash or a Docker daemon failure can stop in-process cleanup. Tearing down the Compose project is the recovery path then.
docs/architecture.md- faultline-runner CLIENT GET /work251.19 ms observedHTTP 504, error
- faultline-frontend SERVER GET /work—HTTP 504, error
- faultline-frontend CLIENT GET /value250.46 ms spanTimeout, no HTTP status
- Toxiproxy · no span · holds the reply for 400 ms
- faultline-dependency SERVER GET /value<0.01 ms spanCompleted
In the 400 ms case the dependency's own span took under 0.01 ms: it answered at once, and the delay lived in the proxy. The frontend's call to it ended at 250.46 ms with a timeout error, so the frontend and the runner both recorded HTTP 504.
All four scenarios in that run
| Scenario | Runner | Frontend’s call | Dependency | Outcome |
|---|---|---|---|---|
| Healthy baseline | 0.42 ms | 0.18 ms | <0.01 ms | HTTP 200 |
| 80 ms latency | 81.28 ms | 80.95 ms | <0.01 ms | HTTP 200 |
| 400 ms latency | 251.19 ms | 250.46 ms | <0.01 ms | HTTP 504, client timeout |
| Recovery | 1.08 ms | 0.69 ms | <0.01 ms | HTTP 200 |
The initial successful milestone-2 integration run, one observation per scenario: a different run from chapter 02. Tracing is optional. A span ID is a correlation handle, not proof that Jaeger stored the trace; Jaeger keeps traces in memory only, and they are not part of the evidence bundle. “Reading a trace”, docs/tracing.md
04History, dashboard and evidence
The run outlives the lab.
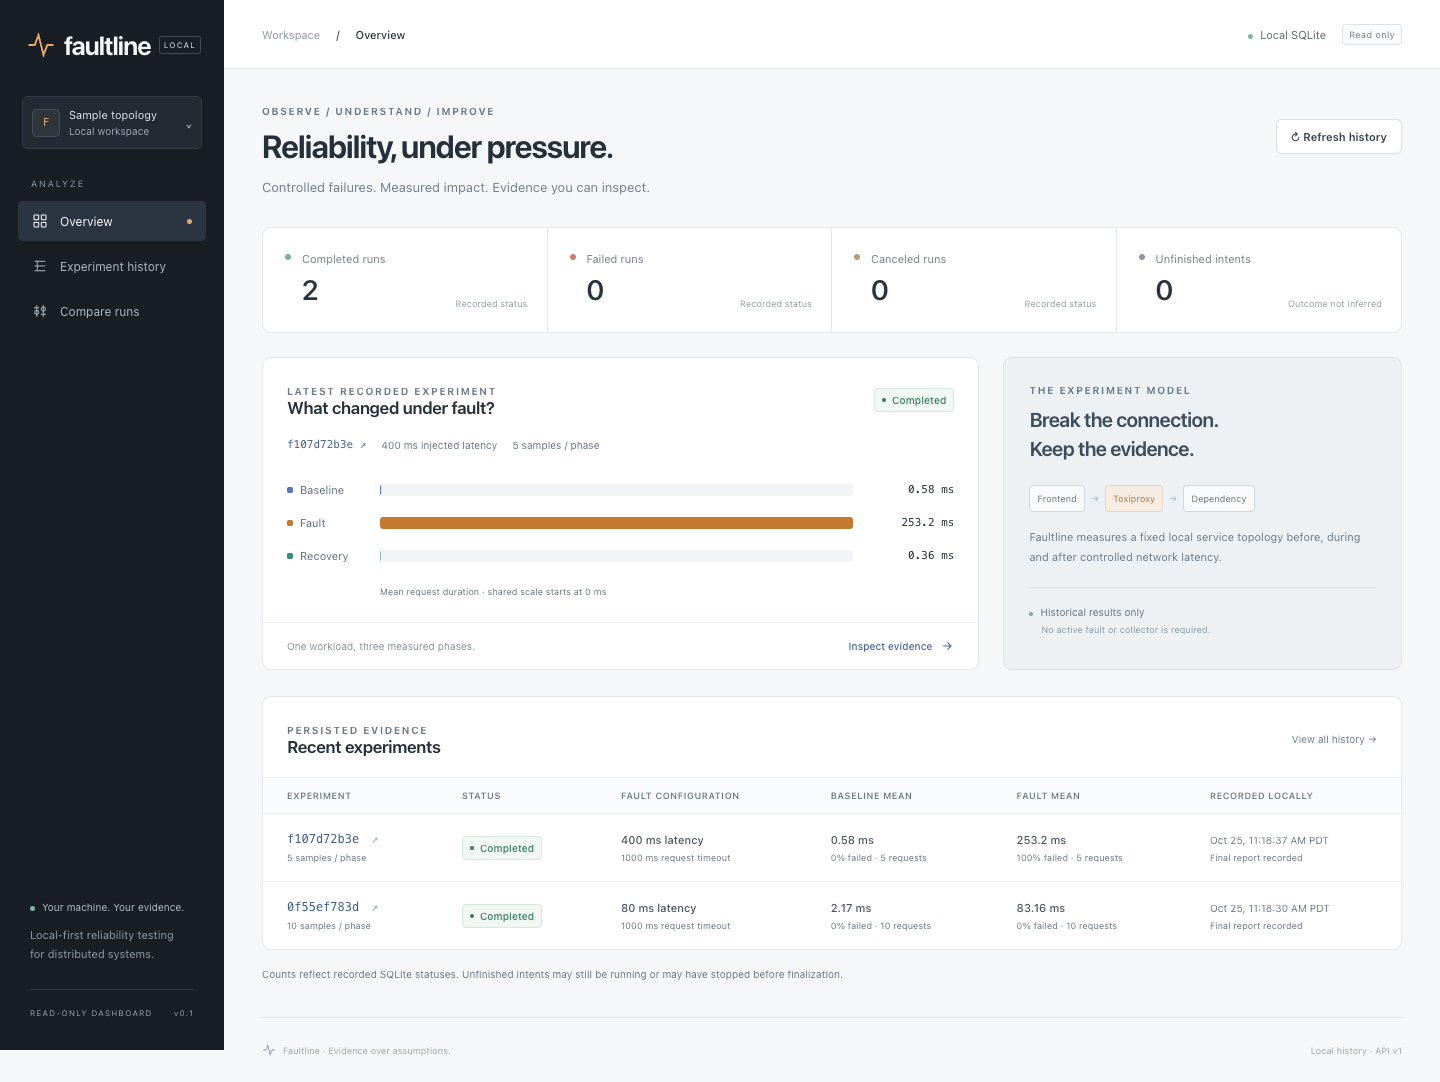
Each run is kept in local SQLite history, browsed in a read-only dashboard, and exported as a .flb file that can be checked without the database, Docker or the network.
- History
- Each run's specification is hashed, and a durable intent is committed before the engine starts; the final report, once stored, is immutable. Runs can be listed, shown and compared from the command line. docs/history.md
- Dashboard
- A read-only dashboard browses that history. It starts no experiments, collectors or Docker services, and binds to the loopback address only. docs/dashboard.md
manifest.jsonFormat, sizes and SHA-256 of the other three filesmax 4 KiBhistory.jsonHistory and run IDs, specification hash, timestamps, statusmax 4 KiBspec.jsonThe canonical experiment specificationmax 4 KiBreport.jsonThe original report, with every raw observationmax 1 MiB
An uncompressed ZIP with exactly these four entries in this order. Fixed timestamps make repeat exports of a run identical: both runs above were exported twice, byte for byte the same.
Checked offline
Verifying or inspecting a bundle needs only the file and the standalone faultline-bundle binary: no SQLite, Docker, Jaeger or network. The final verifier, built without cgo, inspected the 400 ms bundle inside a read-only container with networking disabled.
- clean-80.flb · 4,170 bytes
bb6c3d4ca25d3db32b83f5cdd189027085fb61cab86d796e5dc0dde435ea8572 - clean-400.flb · 5,162 bytes
e265b73a29f2deaa079045996aafc9cf064b05949193389c10319ceff07caea5
SHA-256 detects changed content. It does not prove authenticity, attest that the run happened, or stop samples, summaries and hashes being altered together.
docs/evidence.md05What ships, what does not
The repository holds more than the release.
Release v0.1.0 publishes only the offline evidence tool, for macOS and Linux. Experiments, the full CLI and the dashboard run from source with Docker.
- Released in v0.1.01
- A published release asset
- In source, tested4
- On main, with tests; runs from source
- Unreleased1
- On main after v0.1.0; not in the release binaries
- Experimental2
- On main after v0.1.0; incomplete by design
- Planned2
- Designed or listed in the roadmap; not built
- Unsupported2
- Outside the project's scope
All 12 capabilities, with their sources
Capabilities by status, at main a7d48f0
- Offline evidence tool: verify, inspect, compareReleased in v0.1.0faultline-bundle for macOS and Linux, amd64 and arm64, with SHA256SUMS. Not Developer ID–signed or notarized. Source
- Experiment engine and CLIIn source, testedBaseline, latency fault and recovery on the sample topology, run through the Docker Compose wrapper. Source
- Owned latency fault and cleanupIn source, testedRace-tested against a real Toxiproxy. Source
- OpenTelemetry tracing with a temporary JaegerIn source, testedOptional; off by default. Source
- SQLite history and the read-only dashboardIn source, testedBuilt from source with Go, a C compiler and Node. Source
- Offline reliability gates (faultline-bundle evaluate)UnreleasedPass, fail or indeterminate verdicts on a bundle. Not in the v0.1.0 binaries. Source
- Custom-service lab planner (faultline lab plan)ExperimentalPlans only. It cannot run or clean up a custom lab. Source
- Custom-service supervisor foundationExperimentalAn internal graph and journal, not an executable supervisor. Source
- Labs on services their owner selectsPlannedA design and a threat model only. Source
- More fault types, concurrent load, repeated trialsPlannedListed under “Later” in the roadmap, with a benchmark methodology. Source
- Arbitrary or production targets, browser fault control, a hosted service, AI analysis, statistical significanceUnsupportedExcluded by the README. Source
- Windows and hosted CIUnsupportedWindows is an unsupported cross-build; validation is a local record. Source
06What the record shows
Conclusions the evidence supports, and the ones it does not.
What it shows
- A timeout turns latency into failure. With 400 ms injected and a 250 ms deadline, every request failed, at a mean of 253.20 ms, and the caller never saw how slow the dependency really was.
- Fault injection is safer when ownership, bounds and cleanup are part of the experiment: every proxy has an owner, a time limit and a cleanup that runs even after a failure.
- Evidence is more useful when it can be checked without the lab that made it: one small binary, no database, Docker or network.
Limits
- Five or ten sequential requests per phase. Means and nearest-rank percentiles are descriptive, with no confidence intervals or significance.
- Docker's VM, CPU contention, connection reuse and host scheduling affect timings. Rerunning a specification repeats its structure, not its numbers.
- No concurrent load or repeated trials yet; the project says those need their own methodology.
- macOS binaries are not notarized, Windows is unsupported, and there is no hosted CI.
Sources
- Repository
- Commit a7d48f0 (2026-10-27)
- Release v0.1.0
- Validation record
- Architecture
- Reports and their limits
- Tracing
- Portable evidence
- 80-second demo (README)
Authorship
Personal project · AI-assisted. Implementation details and validation evidence are in the public repository.